Air quality in Europe - 2018 report
The Air quality in Europe report series from the EEA presents regular assessments of Europe's air pollutant emissions, concentrations and their associated impacts on health and the environment.
Based upon the latest official data available from countries, this updated 2018 report presents new information, including:
- updated data on air pollutant emissions and concentrations, and urban population exposure (for 2016);
- extended country scope in the analysis of concentrations, with a more detailed analysis for all the reporting countries;
- information on the status of reporting of PM2.5 (particulate matter with a diameter of 2.5 μm or less) speciation, ozone precursors, and polycyclic aromatic hydrocarbons;
- updated assessments of total population and ecosystems exposure data, and air quality impacts on health (for 2015);
- evolution over time of the health impacts of air pollution;
- a special focus on ozone, with a summary of ozone formation mechanisms in the atmosphere, as well as some abatement strategies and past trends in Europe.
The current report presents an updated overview and analysis of air quality in Europe from 2000 to 2016. It reviews the progress made towards meeting the air quality standards established in the two EU Ambient Air Quality Directives and towards the World Health Organization (WHO) air quality guidelines (AQGs). It also presents the latest findings and estimates on population and ecosystem exposure to the air pollutants with the greatest impacts and effects. The evaluation of the status of air quality is based mainly on reported ambient air measurements, in conjunction with modelling data and data on anthropogenic emissions and their evolution over time.
For the first time, the Air quality in Europe report presents information on concentrations for most air pollutants at country level for all of the EEA-39 countries (the 33 member countries and six cooperating countries). This is thanks to an improvement in the official reporting of data by all countries. We would like to recognise and acknowledge the support from the air quality experts in the different countries.
Ozone
In 2016, 17% of stations registered concentrations above the EU ozone (O3) target value for the protection of human health. The percentage of stations measuring concentrations above this target value was considerably smaller than in 2015 (41%) but higher than in 2014, reflecting the interannual variability of O3 concentrations. These stations were located in 14 of the EU-28 and five other reporting European countries. The long-term objective was met in only 17 % of stations in 2016. The WHO AQG value for O3 was exceeded in 96 % of all the reporting stations, the same percentage as in 2015.
About 12 % of the EU-28 urban population was exposed to O3 concentrations above the EU target value threshold, which is a considerable decrease compared with the high exposure of 2015 (30 %). However, the percentage is still higher than the 7 % recorded in 2014. The percentage of the EU-28 urban population exposed to O3 levels exceeding the WHO AQG value was 98% in 2016, scarcely showing any fluctuation since 2000 (Table ES.1).
Nitrogen dioxide
The annual limit value for nitrogen dioxide (NO2) continues to be widely exceeded across Europe, even if concentration and exposure are decreasing. In 2016, around 12 % of all the reporting stations recorded concentrations above this standard, which is the same as the WHO AQG. These stations were located in 19 of the EU-28 and four other reporting countries, and 88 % of concentrations above this limit value were observed at traffic stations.
Table ES.1 Percentage of the urban population in the EU-28 exposed to air pollutant concentrations above certain EU and WHO reference concentrations (minimum and maximum observed between 2014 and 2016)

PM10 concentrations continued to be above the EU daily limit value in large parts of Europe in 2016 (27 countries). Map 3.1 shows concentrations of PM10 in relation to the daily limit value. 19% of stations reported concentrations of PM10 above this daily limit value in 19 Member States and eight other reporting countries (see Figure 3.1). 97 % of those stations were either urban (87 %) or suburban (10 %). Some of these high daily mean PM10 levels were observed during high PM10 pollution episodes in the winter, spring and autumn of 2016.
Map 3.1 Concentrations of PM10, 2016 — daily limit value
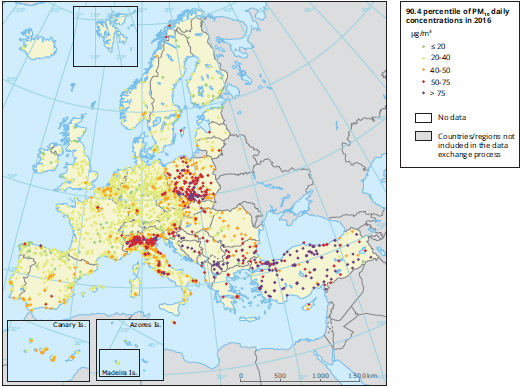
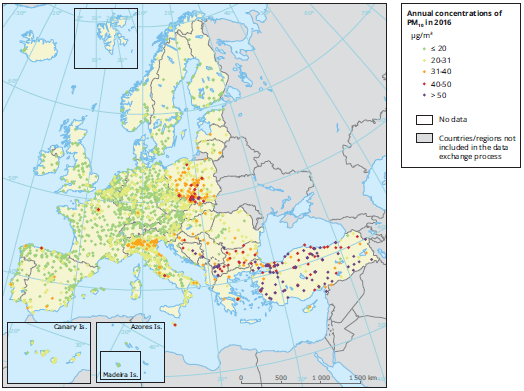
Map 3.2 Concentrations of PM10, 2016 — annual limit value
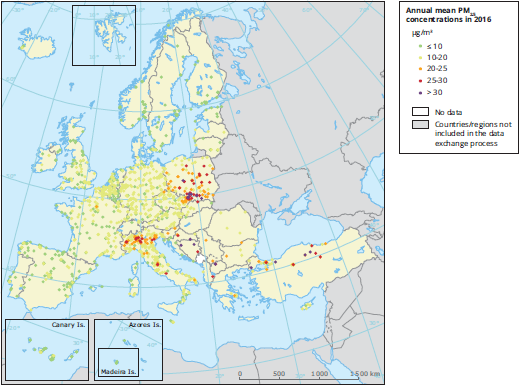
Map 3.3 Concentrations of PM2.5, 2016 — annual limit value
Fonte
EEA 2018
Collegati
Allegati
|
Descrizione |
Lingua |
Dimensioni |
Downloads |
 |
|
EN |
14919 kB |
1209 |
